This blog post may contain affiliate links. If you click on these links and make a purchase, I may receive a commission at no extra cost to you. Please note that this blog is primarily for educational purposes and the content here is not intended to be a substitute for professional financial advice. Please review my disclaimer and terms here.
When the show Tiger King was popular during quarantine, I used Google Trends to research potential design ideas and keywords related to the show. I talk more about what I did in this video, but taking a little extra time to do this research lead to $1,727 in sales (and counting).
Using Google Trends isn’t necessarily a “low hanging” way of coming up with new niches and design ideas, however, as you aren’t just throwing spaghetti at the wall.
With LHS, you primarily want to focus on evergreen products, or products that work all year round. But if you want to scale up and capitalize on seasonal trends and pop culture topics, Google Trends is a great tool.
It helps you create designs people want, when they want them, and get a leg up on the competition in doing so.
The main reason my Tiger King designs did so well was because of timing. Lots of people were searching for Tiger King products at that time. So when they found my designs, purchasing was a no-brainer.
Using Google Trends can help you do what I did with my Tiger King designs for other current TV shows, movies, and more.
(Just be sure not to copy any phrases word for word. Always be mindful of copyright infringement.)
Below, I walk you through how Google Trends works and how you can use it to find winning ideas and compare potential niches for your business.
Let’s dive in…
How to use Google Trends for your LHS business
Go to Trends.Google.com. You’ll see this:
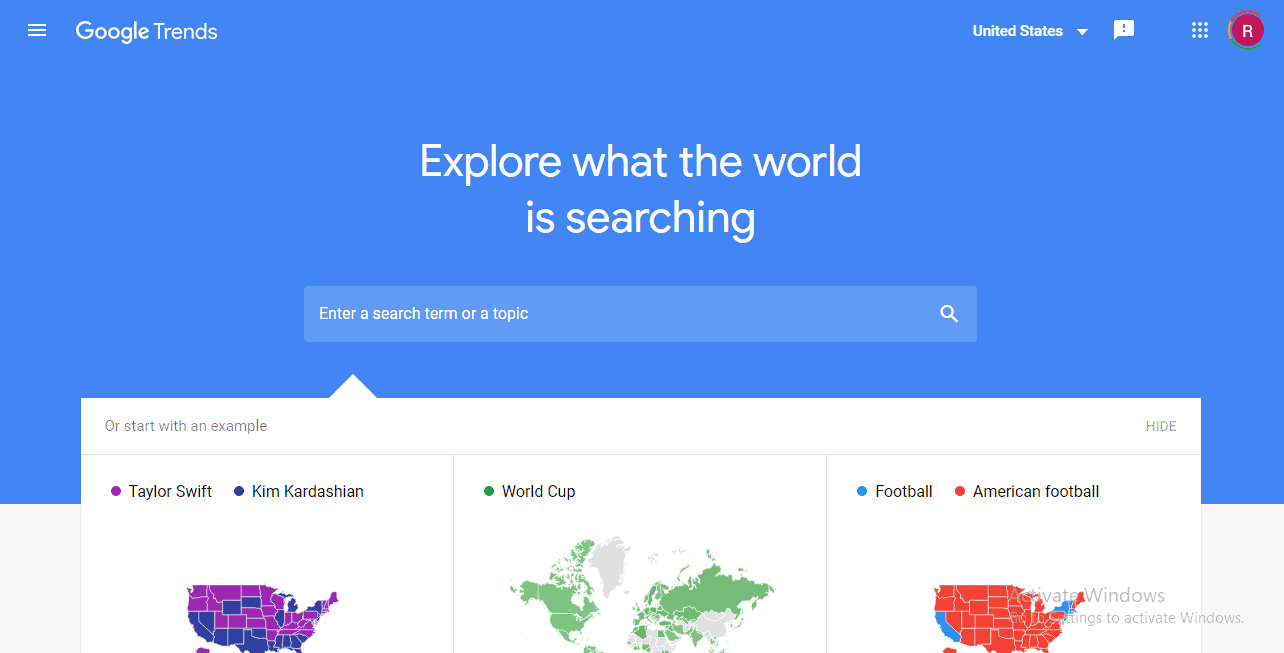
Click the icon with the three horizontal lines at the top left (open menu). Choose explore.
You can enter a search term or a topic in the space provided or you can start with one of the examples, as shown in the screenshot below.
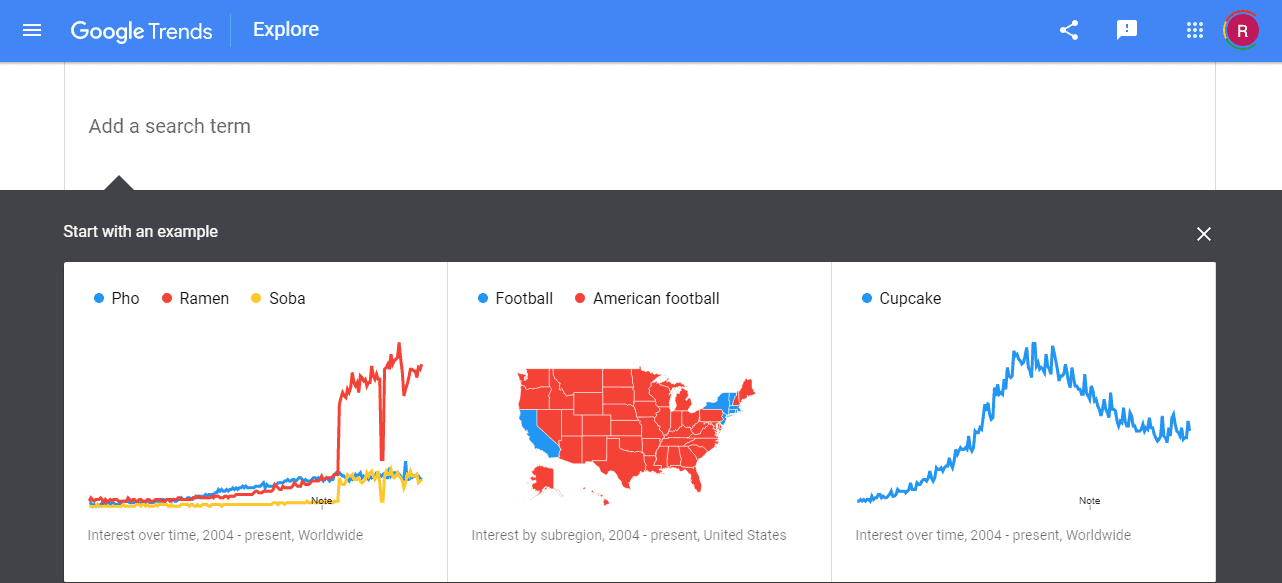
You have the option to choose the country you want to focus on or you can search worldwide.
You can also specify your search timeframe (e.g. past 12 months, past 4 hours, past day, past 7 days, etc.) or search based on a specific category (e.g. arts & entertainment, autos & vehicles, beauty & fitness, books & literature, etc.).
Additionally, you can select if you want to do a web search, image search, news search, Google shopping search, or a YouTube search.
If you’re trying to gather a lot of new ideas, I’d suggest leaving your search filters open.
When you enter a term into the space provided, you get a graph showing you how the interest level in that keyword or niche has fluctuated over time.
For example, when I enter “dog owner gift,” this is what I see:
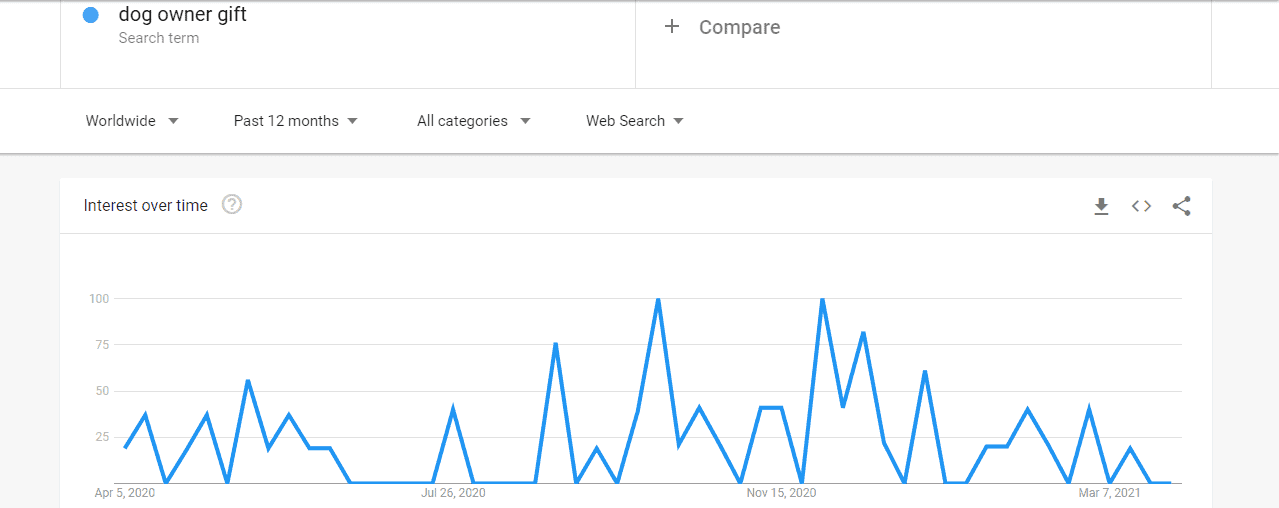
If you hover your mouse over the graph, you can see specifically when each spike and dip occurred. The two biggest spikes happened between October 4 and 10, 2020, and November 29 and December 5, 2020.
Comparing search terms
After looking at the graph for one search term, you can add another search term to compare. For example, since I was previously searching for “dog owner gift,” I might now search for “cat owner gift” to see which term is more popular.
Here are those results:
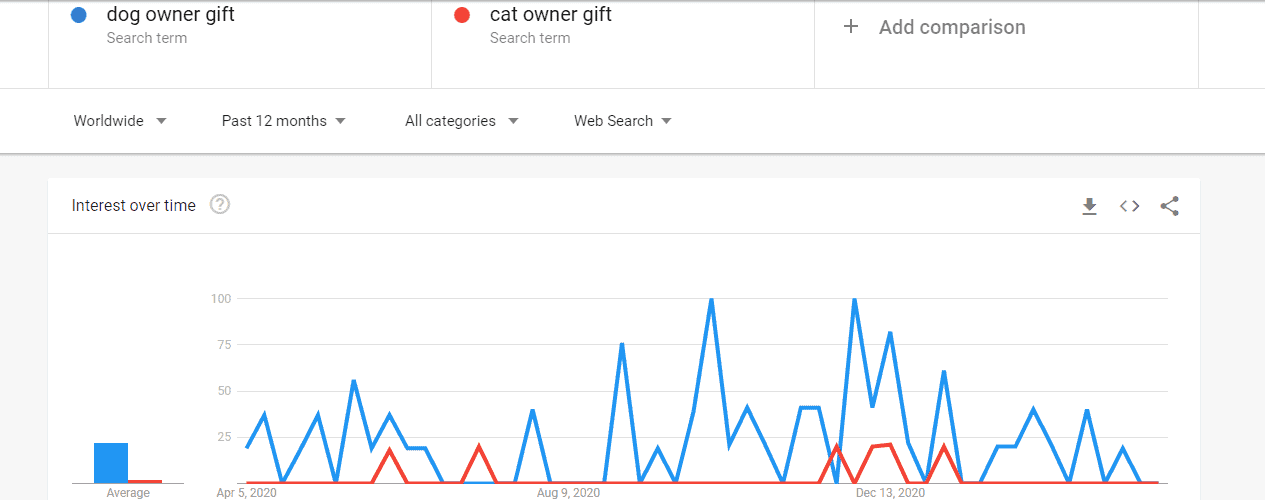
As you can see, “dog owner gift” is significantly more popular. So if you were trying to decide whether to create dog- or cat-related designs, the decision should be pretty easy looking at these results.
You can, of course, drill down even more and type in specific dog breeds, such as rottweiler or chihuahua, and see what those comparisons yield. (You can also compare more than two terms at a time.)
Ideally, as you type in your terms, you want to look for upward trends — that is, graphs that show search volumes increasing over time.
(Neither “dog owner gift” nor “cat owner gift” is trending upward, but the spikes are various times throughout the year are still interesting to note.)
Checking interest by region
Below the graph(s), you’ll find a map of the world. This map shows you all of the locations in which your search term was popular during a specified timeframe.
According to the popup:
“Values are calculated on a scale from 0 to 100, where 100 is the location with the most popularity as a fraction of total searches in that location, a value of 50 indicates a location which is half as popular. A value of 0 indicates a location where there was not enough data for this term.”
This is what I see with the term “dog owner gift” for the past twelve months:
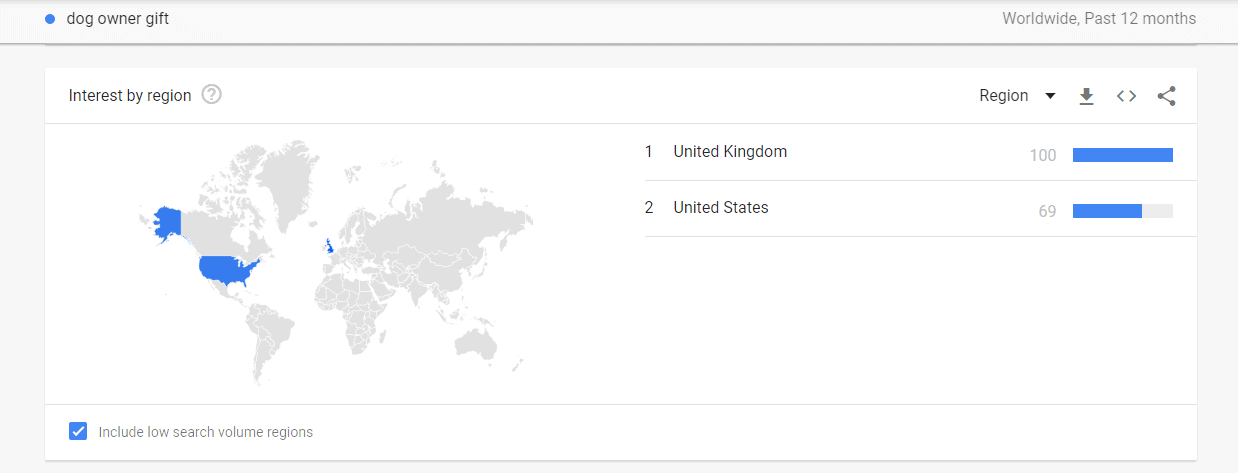
As you can see, this term is only popular in the United Kingdom and the United States.
If you want, you can also search by City instead of Region. At the top right, click the down caret next to Region and select City from the dropdown.
(When I did this for “dog owner gift,” I was told the search didn’t have enough data to show.)
Checking interest by region and/or city can be helpful if your target market resides in a particular location.
Looking at related topics and queries
This is the section below the map. It shows a list of topics and queries related to your original search.
I didn’t have a lot of results here from my “dog owner gift” search. So I tried a new term: “dog lover.”
There are two ways to look at your results:
- Rising
- Top
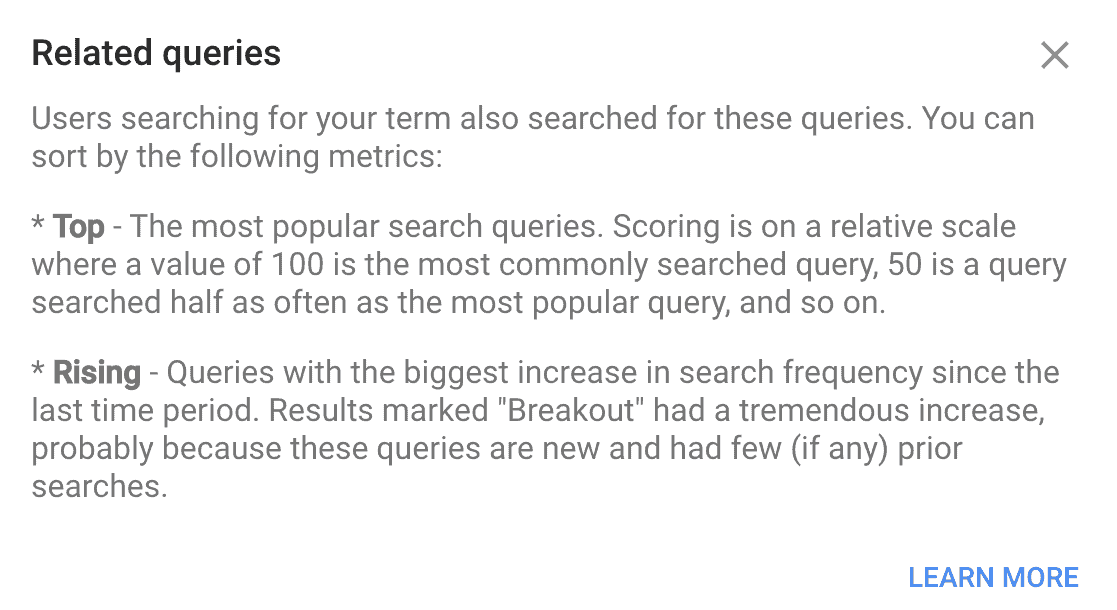
Both Rising and Top are called Related Queries. They’re the metrics Google Trends uses to determine how trendy a topic is, and each one has its advantages.
You’ll first want to filter this out to the Top Queries to see what people are searching for. Rising Queries indicates a phrase or topic that is slowly becoming a trend.
Here are my results:
Related Topics – Rising
- Personalization – Topic
- Sweater – Clothing
- Girlfriend – Topic
- Tibetan people – Ethnic group
- Hero – Topic
- Bulldog – Dog breed
- Dutch people – Ethnic group
- Dutch language – Spoken language
- Husky – Dog
- Fur Topic
Related Topics – Top
- Dog – Animal – 100
- Love – Topic – 62
- Gift – Money – 17
- Quotation – Literary genre – 12
- Animal – Topic – 5
- Pet Lovers Centre – Pets Company – 4
- Pet – Topic – 3
- Synonym – Topic – 3
- Puppy – Animal – 3
- Mug – Topic – 3
- Friendship – Topic – 2
- Shirt – Garment – 2
- T-shirt – Clothing – 2
- Dog breed – Topic – 2
- Happiness – Topic – 2
- Personalization – Topic – 1
- Sweater – Clothing – 1
- Girlfriend – Topic – 1
- Tibetan people – Ethnic group – 1
- Hero – Topic – 1
- Bulldog – Dog breed – 1
- Dutch people – Ethnic group – 1
- Dutch language – Spoken language – 1
- Husky – Dog – <1
- Fur – Topic – <1
Related Queries – Rising
- dog lover shirts – +160%
- dog lover t-shirt – +50%
Related Queries – Top
- the dog lover – 100
- dog lover gifts – 83
- dog lover quotes – 75
- dog lover gift – 56
- gifts for dog lover – 46
- gift for dog lover – 43
- happy birthday dog lover – 20
- dog lover shirts – 17
- dog lover status – 14
- dog lover t shirt – 14
- dog lover caption – 11
- dog lover sweatshirts – 3
As you can see, not all of the “related” topics and queries pertain to my original search. But there are still design ideas to be found. Based on these results, I’d know to focus on puppies, bulldogs, and huskies. I’d also see that shirts are an especially popular topic amongst dog lovers.
If you’re able to find a good related trending topic here, you can piggyback on that and create designs with more widespread appeal.
Expanding your timeframe
The results and screenshots I’ve shared with you all had a timeframe of the past twelve months. But you can expand your timeframe to cover the last five years or you can specify a custom range.
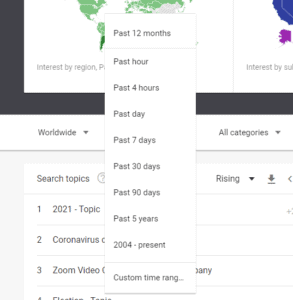
Expanding your timeframe gives you more data so you can get a bigger picture look at what’s going on with a particular search term. You can see if its movement on the graph (upward, downward, flat) is consistent over time or if it changes.
You can also look for patterns with spikes in the graphs. Do the spikes occur around the same time each year? Some niches are seasonal and spikes occurring at more or less the same time reflect that.
You don’t want to have seasonal draughts with your products. So if you find a niche that you suspect has seasonal appeal, you wouldn’t want to make ALL of your designs pertain to that niche.
But you can look for seasonal niches that complement each other (i.e. when one is spiking, the other is dipping and then they switch). Or, you can use the spikes to gauge the best times to run promotions for certain products.
Here’s a current trend you can profit from now
With Mother’s Day right around the corner, you can bet a lot of people are searching for Mother’s Day gifts right now.
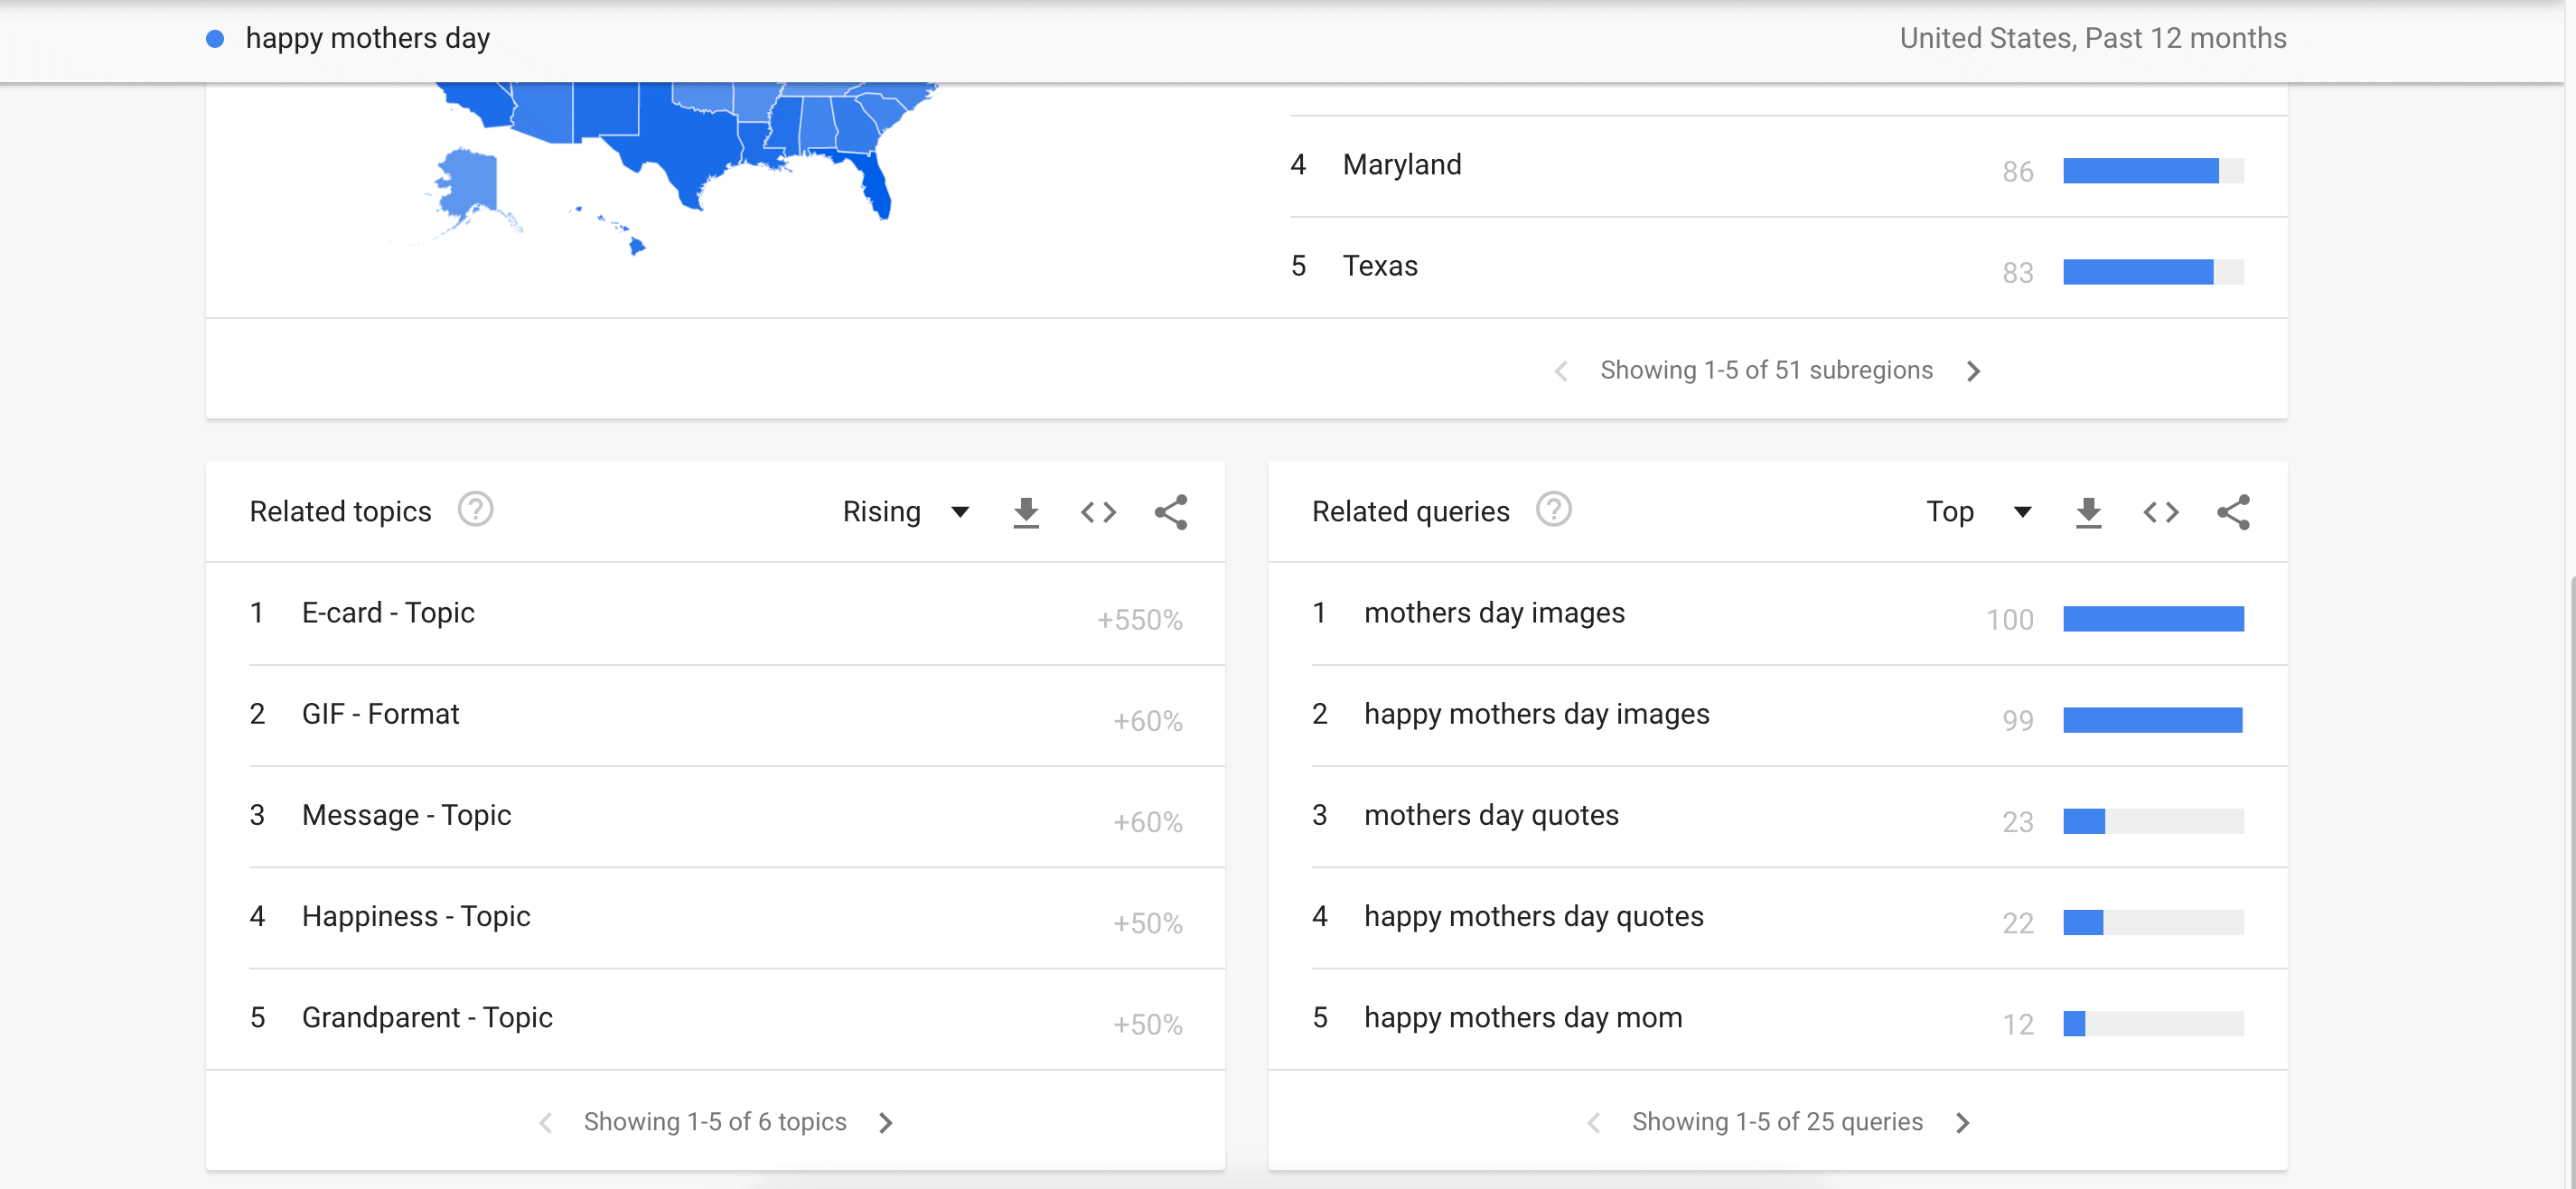
I did a quick Google Trends search for Mother’s Day and the third related top query was Happy Mother’s Day:
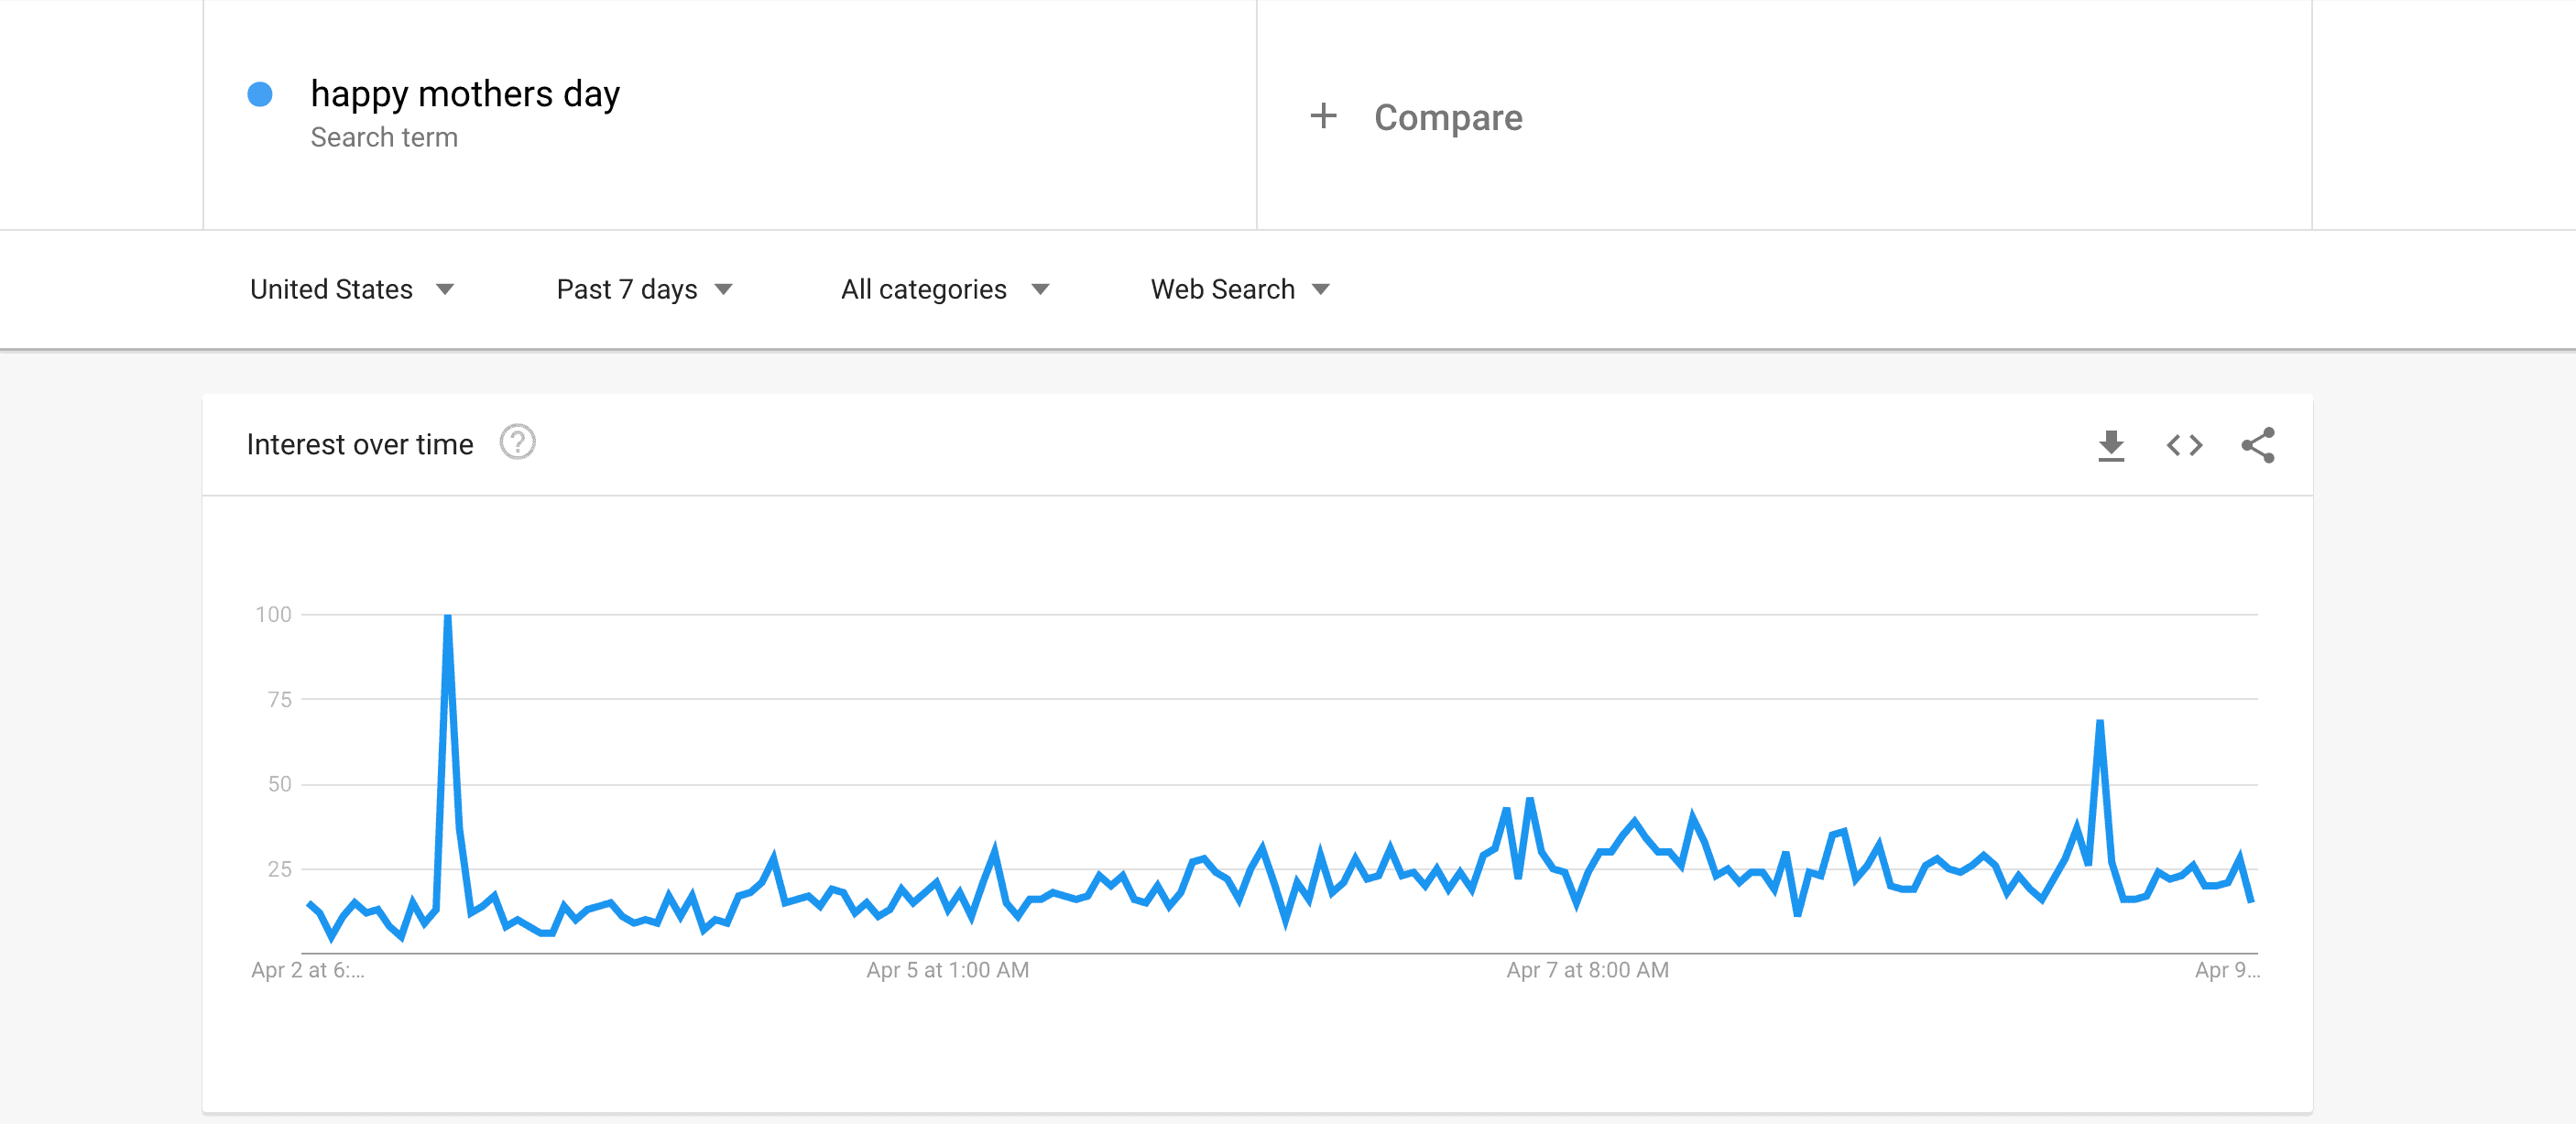
When I scrolled down, I saw that the related topics were eCards, grandparents, Mother’s Day images, and Mother’s Day quotes. And while this might be obvious, what this shows is people are looking for easy ways to express love toward their mothers, such as with printables.
In fact, eCards are up by 550% in searches. So instead of guessing what kind of products might work or not work well, you can use Google Trends to not only save time but also scale up your stores at the best and most critical times of the year.
Optimizing your research
Don’t forget to use the LHS Accountability Template to keep track of any keywords and design ideas you come up with using Google Trends.
And to really optimize your research, I’d suggest using tools like Keywords Everywhere or Erank in addition to Google Trends.
Keywords Everywhere and Erank can help you find highly searched keywords and topics that don’t have a lot of competition. Then, you can plug these terms into Google Trends to discover the best time to add products in these niches to your store.
What are your thoughts on Google Trends? Have you used this tool before? Leave a comment below and let me know! Also, if you liked this post, please share it with your friends and followers.



1 thought on “How to use Google Trends to find design and keyword ideas, and compare niches”
I always read yoyr emails becayse they’re so interesting and relevant. Thanks Rachel.